Visual Acuity Test – Snellen Test
Table Of Contents
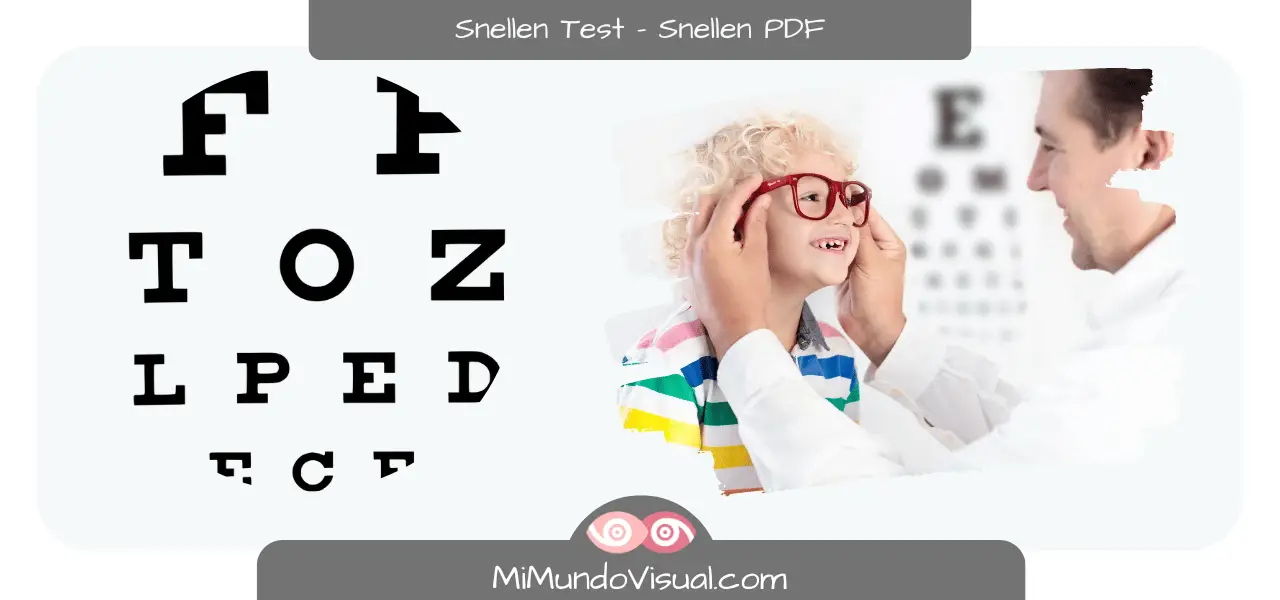
One of the most well-known visual acuity tests is the Snellen test, performed with the Snellen chart.
In this article, we’ll learn more about:
- What is the ‘Snellen test.’
- Who was the Creator ‘Hermann Snellen’?
- What is the Snellen Chart for?
- How to interpret the results of the Snellen Test
We also have a free PDF download of the Snellen Test (with instructions) for you at the end of this blog post!
What is the Snellen chart?
The Snellen test is a test to will help us evaluate visual Acuity using a chart known as the Snellen chart. To perform this test correctly, the letters that appear on the Snellen chart must be identified.
The traditional Snellen chart has the letter E in the first line and another nine letters (C, D, E, F, L, O, P, T, and Z) that are distributed in the rest of the rows. Usually, the test comes with 11 rows of capital letters.
However, we can indeed find versions with a different number of rows. In each of these rows, the letters will appear in decreasing size. In essence, the important thing is not the number of rows but the size of the letters linked to the Snellen fraction.
Each row is assigned a visual acuity score. The last line we can read will determine our visual Acuity.
The original SnellenTable published in 1862 is composed as follows: A, C, E, G, N, P, R, T, 5, V, Z, B, D, 4, F, H, K, O, S, 3, U, Y, A, C, E, G, L, 2 in a grid of 5 x 5, these alphanumeric symbols that are reducing in size, are known as optotypes.
Who was Hermann Snellen?
Hermann Snellen (1834 – 1908) was born in Zeist (Utrecht in The Netherlands) on February 19, 1834. He studied medicine with Gerard Johann Mulder (1802-1880), Jacobus Ludovicus Conradus Schroeder van der Kolk (1797-1862), and Franz Cornelis Donders (1818-1889). He received his doctorate in 1858.
He is still remembered today for his creation of the Snellen Chart in 1862, named after him. Snellen was the first to introduce a scientific standardization of visual acuity measurement from a text.
This early test had limitations as it was based on words, and the patient had to interpret the next word. It was later changed to letters.
The Snellen chart became widespread in 1863 after the British Army used it. From that moment on, it became a standard in vision testing for almost a century.
Its 5 x 5 grid ortho-type design is the basis for all other ocular charting systems. It is still the most widely recognized design for measuring visual Acuity today.
However, we should also mention that the first tests for measuring visual Acuity were designed by Heinrich Küchler (1811-1873). He was a German ophthalmologist who – in 1836 -began using figures cut out of newspapers, books, and calendars and pasted them in rows on paper. Each row represented a figure in a smaller size.
What does the Snellen scale evaluate?
The Snellen test checks a person’s visual Acuity. It is used to detect a decrease in visual Acuity if this is suspected or as a prevention method.
When evaluating and measuring visual Acuity using the ‘Snellen chart,’ it is a requirement to be positioned at a distance of 20 feet or, to be exact, at 6 meters and 9.6 centimeters (generally rounded to 6 meters) from the Snellen Chart.
As most eye doctor offices do not have enough space to place us 6 meters from the Snellen Chart, the Chart has been re-configured to have the same values as if it were at that distance.
The ophthalmologist or optometrist will evaluate each eye separately with glasses and without lenses while covering one eye at a time.
The patient must remain seated at the same distance at all times, and as the patient moves through the chart, the size of the optotypes will change., The optotypes will become smaller and smaller according to the Snellen fraction. The fraction number will increase with each row.
The last row that the person can read accurately will determine his visual Acuity.
What is the Snellen fraction?
The Snellen fraction refers to the measurement of visual Acuity, where the number at the top of the fraction represents the distance between the person and the Snellen chart, i.e., 20 feet away. The bottom indicates the distance at which a person with optimal vision can read the same optotype.
For example, a Snellen fraction of 20/40 represents that a person with normal visual Acuity (20/20) can see this optotype at a distance of 40 feet instead of 20 feet or 12 meters instead of 6 meters.
This means that a person with a visual acuity of the Snellen fraction 20/40 has a vision of 50%, i.e., half. And it means that this person has been unable to visualize optotypes smaller than these (size of 17.7 mm at a distance of 6 meters).
How to interpret the results of the Snellen test?
To interpret the results of the Snellen test, the most important thing to remember is that each Snellen fraction is linked to the size of each letter or optotype in the test. We can find different varieties of Snellen charts where the number of total rows of optotypes can vary.
In other words, the interpretation of the Snellen results will depend on the number of Snellen fractions.
For example, a popular Snellen version will have the following fractions: 20/200, 20/100, 20/70, 20/50, 20/40, 20/50, 20/50, 20/40, 20/30, 20/25, 20/20, 20/15, 20/12 and 20/10 with a total of 11 fractions.
Another Snellen Chart might have nine fractions like 20/200, 20/100, 20/80, 20/63, 20/50, 20/40, 20/32, 20/25, and 20/20.
It is therefore essential to note that if we compare both tests: in the first one, the visual Acuity 20/20 is in the 8th line (with the letters D E F P O T E C), and in the second version, the same letters D E F P O T E C are in the same row number 8, but they are equivalent to a Snellen fraction of 20/25 (instead of 20/20 as in the previous case).
We emphasize this point as both tests are technically correct, so we want to stress the importance of the size of the optotype and its link to the Snellen fraction!
How big are the letters of the Snellen chart?
The letters of the Snellen chart have a different size in each line.
The first letter is the largest, measuring 88.6 mm. On the Snellen Chart, it refers to the fraction of 20/200 feet. For those who use meters as a metric system, it represents the fraction 6/60, where both 6 and 60 refer to meters and not feet.
The first value determines the legal blindness value. The optotype that determines the fraction of 20/20 has a size of 8.8 mm.
In the Table below, you can see the size of each optotype seen at 6 meters (or 20 feet) linked to the Snellen fraction to which it corresponds in each case.
To interpret the results obtained in the Snellen Test, we must understand how it is structured, starting from the first big E that presides over the test and is linked to the Snellen fraction of 20/200.
The letter E must be 88.6 mm in size to perform the test under proper conditions. The viewing distance should be 6 meters or 20 feet.
A person with correct visual Acuity should be able to see this same-sized letter at a distance of 200 feet (20/200) or 60 meters.
As we go down the chart and progress through the test, the size of the optotypes gets smaller, and the Snellen fractions get smaller and smaller until we reach a Snellen fraction of 20/20. The 20/20 fraction is considered the baseline and indicates a ‘normal or optimal visual acuity. That said, specific Snellen charts will indicate fractions lower than 20/20. If people can see those fractions, it merely indicates that they have a vision that is above average or above that baseline.
Conversion Chart for visual Acuity
| Snellen Fraction (20 feet) | Snellen Fraction (6 meters) | Decimal | LogMAR | Letter size in mm |
|---|---|---|---|---|
|
20 / 200 |
6 / 60 |
0,1 |
+1,0 |
88,6 |
|
20 / 160 |
6 / 48 |
0,125 |
+0,9 |
70,88 |
|
20 / 125 |
6 / 38 |
0,16 |
+0,8 |
55,37
|
|
20 / 100
|
6 / 30
|
0,2
|
+0,7 |
44,3 |
|
20 / 80 |
6 / 24 |
0,25 |
+0,6 |
35,44 |
|
20 / 63 |
6 / 19 |
0,32
|
+0,5 |
27,9 |
|
20 / 50 |
6 / 15 |
0,4 |
+0,4 |
22,1 |
|
20 / 40 |
6 / 12 |
0,5 |
+0,3 |
17,7 |
|
20 / 32 |
6 / 9,5 |
0,63
|
+0,2 |
14,17 |
|
20 / 25 |
6 / 7,5 |
0,8 |
+0,1 |
11,1 |
|
20 / 20 |
6 / 6 |
1,0 |
|
8,8 |
|
20 / 16 |
6 / 4,8 |
1,25 |
-0,1 |
7,08 |
|
20 / 12,5 |
6 / 3,8 |
1,6 |
-0,2 |
5,537 |
|
20 / 10 |
6 / 3 |
2,0 |
-0,3 |
4,43 |
Below, we show a conversion table so that we can know, at any given moment, what the interpretation of visual acuity results is equivalent to, depending on the metric system we usually use.
We also add the equivalent values in decimals and LogMAR and the size of the letters (or optotypes) in mm. The resulting figure will represent our visual Acuity.
A correct visual acuity, according to this Table, corresponds to 20/20. Values below 20/20 indicate reduced visual Acuity, and values above 20/20 indicate increasing degrees of Acuity.
Make sure to distinguish the Snellen test results from diopters since diopters are the measure of correction of refractive errors. You can have 0 diopters and be practically blind or have five diopters and still have good visual Acuity.
How to interpret results obtained from the Snellen chart?
What does 20/20 mean?
20/20 indicates a person’s normal vision at 6 meters or 20 feet away. However, having 20/20 vision is not the same as saying you have perfect vision since 20/20 refers to visual Acuity or the sharpness of vision. It translates to the clarity with which we can see an object at a distance of 20 feet (6 meters).
What does 20/30 mean in vision?
20/30 means seeing at 20 feet what an average person can see at 30 feet.
Another way to score visual acuity results is to use the decimal system where:
1 corresponds to a visual acuity of 100%.
1.2 is a visual acuity of 120%.
0.9 90% visual Acuity
0.1 10% visual acuity
In other words, if we take the above measurements, we must divide the numerator from the denominator to obtain the visual acuity value.
So, what does 20/50 vision mean?
20/50 indicates that the person’s visual Acuity is 40% or 0,4
What is 20/40 vision?
20/40 corresponds to a person who has a visual acuity of 50% or 0,5
Adult Snellen chart
The Snellen chart used for adults is one composed of alphabetic letters, however for adults who cannot read or do not know the Latin alphabet, other types of charts are used:
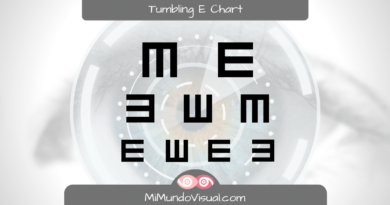
The E optotype chart, for example, is a chart with rows composed only with the letter E printed in different positions and decreasing size. The person has to identify in which position this is—legs of the letter E up or down and left or right.


The Landolt C test table is similar to the previous Table. It uses the same calculation system as the Snellen Table.
In the Landolt table, we find incomplete circles organized in the same way, in decreasing size and in different positions.
Snellen chart for children
To be able to perform a visual test on an adult is very simple since it is easy to communicate and interact with them. This may be different with children, especially at very early ages when performing the first visual tests.
Children’s visual examination must be fun and fast so that they can stay focused during the assessment.
As with illiterate adults, the E-optotype test is also used with children since, in this case, the child does not have to know what is being shown but can indicate the letter’s direction at any given moment. If the child is very young, they can be instructed to point with his finger in the direction of the paws.
The snellen chart in PDF
To better understand what the Snellen chart looks like and how you can use it, we have arranged a PDF version for you to download here for FREE.
In conclusion:
Remember that The Snellen test is only a part of the eye specialist’s visual examination. This test only evaluates the visual Acuity of the person. Other aspects must be considered for a complete visual assessment of a person!
Includes color vision, the ability to focus, depth perception, and coordination between your eyes and peripheral vision.